Thursday, July 28, 2011

What's a fraction?

I remember when I first started to learn about fractions and decimals.  I used to stress about them constantly because I had such difficulty understanding them.  I was told over and over again that fractions and decimals went hand and hand.  For whatever reason I just didn't see the connection.  My teacher used to hold up flash cards with fractions and their corresponding decimals.  We were drilled until we memorized what decimal went to what fraction.  I never did memorize them, in fact I never even tried.  I didn't understand the core of why they were linked together.  Why would I care about memorization?  Looking back I wish my teachers would have spent more time showing us more in depth what the connection was.  Eventually when we started learning place values things came together.  I remember thinking, Duh!  Once I knew the place values in decimals were the denominators in fractions I began to feel more connected.  

Manipulatives are wonderful tools to show students the guts of mathematics.  I am a visual learner so for me it is particularly helpful.  I have faint memories of some manipulative activities but I don't think they were used as heavily as today.  So far in my observations I have noticed a huge emphasis on the use of manipulatives.  The students seem to love using them because they get to play as well.  Most of the time the teachers give them some free play time before the lesson starts. I think it is a great way to calm down the kids and allow them to focus.

This video uses drawings as a way to give students a visual of how fractions work.  I think either drawing it out or using manipulatives is the most straight forward approach.  I found this video at a home schooling website.  The subsection talks about how common the struggle to grasp fractions is.  I was relived to see that my situation wasn't unique to me.  This site also talks about the benefits of using manipulatives.
Tuesday, July 26, 2011

How many cups are in a quart?

When cooking I often find myself asking questions like this.  Usually I think I know the right answer but feel the need to double check with a source.  Often times I pull out my trusty iPhone and Google the question.  Wouldn't it be wonderful if it was made sure that all children memorized these basics?  The sad truth is not all of us do but it is never too late.  I know as a future teacher I want to find fun little tricks to keep the attention of my students.  It is important to offer a variety of memorization options to a variety of learning types.  While searching the web for some resources on this I found several helpful sites.

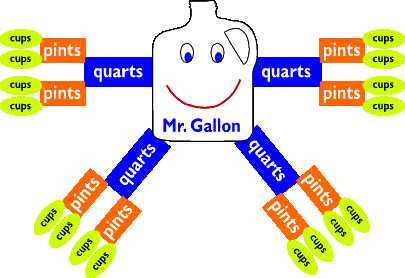
Here we have Mr. Gallon.  I love this image because it really speaks to the visual learner.  It visually breaks down the relationship between cups, pints, quarts, and gallons.  I think this, or a similar illustration would be very helpful to hang in the classroom.  I also feel it would be beneficial as a laminated handout for each student to keep.

I found Mr. Gallon at this site along with some other tips.

For students who prefer remembering an acronym they can always use Great Queens Pick Clean Okra.  This is a great way to remember the order from biggest to smallest and also includes ounces.  


Monday, July 25, 2011

Not all data graphs are created equal

When learning about graphs it is important that in the big bad world there are graphs that exist to deceive you.  People intentionally create a biased graph to portray an image to suit their perception or message they want to convey.  This is why it is important to be able to understand the guts of a graph and the minimum requirements for accuracy.

The organization of the data is one of the most important steps towards a readable presentation of a graph.  Here is an example of useless information rendering the graph itself useless.


According to this website I found, the most common way to distort a graph is to adjust the starting point on the scale.  This in return can make the differences between data seem larger.  This is a great scare tactic that people use to represent crime statistics and other things in order to manipulate public opinion.  

I am glad that I have been able to learn how to accurately read graphs so I can avoid falling prey to false statistics.  After all some people say 99% of statistics are made up on the spot! ;)

Please wait while I find a calculator....

Working in the service industry you would think figuring out tip percentages would come fast and easy to me.  The reality is I am always scrambling for a calculator to figure out what the tip for my total bill should be.  People often have tried to rattle off quick tips to no avail.

Finally I have sought out a website that has shown me some really great tips to use.  Using 10% as the base for the tip makes the computing easier.  Once you figure out your tip based on 10% you can have it and add another half on top of it for 15%.  You can also double, triple, and so on to get 20% and above.

The simplest tip I found at this website: click here was moving the decimal one place to the left of the total to find the 10% tip.

You can use this with or without actual change.  For example take an even $10 and move the invisible decimal point over to the left one place.  This gives us $1 for a 10% tip.  To give 15% we can add half of our result back to our result to get $1.50.  Or we can double and triple it to get 20% = $2 or 30% = $3.

I am going to work on using this technique at work and when I am out in the world needing to leave a tip.  I think the more I practice, eventually it will be second nature and I wont be scrambling to find a calculator.


Tuesday, July 5, 2011

Shapes: The Building Blocks

Cedar Fork Second Graders and Geometry
While watching this video I was pleased once again to see how well hands on activities work.  In the video the administrator talks about the need for students to understand the language.  It truly is important for students to be able to talk about math.  They need to understand the terms and be able to ask specific questions.  The building of the shapes really helps students to understand the shapes.  Once again we are shown how much benefit there is in cooperative learning.  This practice not only helps students get better at math but it also enhances their communication skills.

I found some videos on YouTube that simplify the process of comparing shapes and finding proof of similarity.  The video I am including shows how to determine if a pair of triangles are angle-side-angle congruent.  I liked the videos because they are geared toward young children.


Here is a reference sheet for students to help them learn what the different polygons are.

I found a website that I want to keep for future reference with some wonderful free worksheets.  I thought I would share: http://www.superteacherworksheets.com/geometry.html

Monday, June 20, 2011

Mean, Median, and Mode oh my!

I hate to admit that at age 27 I still mix these up, but I do.  For some reason these have always been a struggle for me.  I find that I have to have notes about them on hand to reference.  The benefit of doing exercises with these over and over this week is I am retaining the information.  Finally after years of doing math I started to automatically know what to do when asked for the mean.  I actually came up with some silly things to help me remember. 

While working on the mean of a problem I found myself saying “I mean average”.  Somehow this helped me to remember mean=average.  Once I made that connection I could easily find the “average”.

To remember median I just reminded myself that a median is in the center of the road.  Just like the median is the middle number, or average of the two middle numbers. 

For mode I just tried to say “mode most frequent” over and over until I remembered those words together.

Range was easiest for me because I trained myself to think the range in between is the smallest minus the largest number.

Another important thing I learned is not to get lazy and jump right in without order.  I always put the numbers in ascending order right away.  I found a website with some tips for remembering mean, median, and mode.  There is a cheesy little video with a song at the bottom to assist in remembering.  I think it would be helpful for younger children.  http://www.classbrain.com/artaskcb/publish/article_143.shtml

Working on these topics reminds me of why it is important to pay attention in math class.  There is a reason we learn things several times in our school careers.  I used to get frustrated at the repetitiveness and not pay attention.  Now I pay the price because I didn’t memorize many things my teachers were conditioning me on.
Overall this week wasn’t too difficult once I got the rhythm down.  I find graphing to be a bit easier for me, maybe because I am such a visual person.